|
Graph Maker...
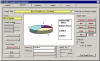
Graph Report interface.
The software can also produce bar graphs based on the data using a format
similar to the Report Writer. A graph can be produced by combining up to six
fields selected from the same seven main areas.
The Graphs are broken down into seven main areas:
- Employee Data
- Incident, Injury Types
- Recurrence/Continuity
- Costs, Costs by Injury Types
- History
- ToDo Action Item.
T he main concepts are:
- Selection of fields to select
and graph data on.
- Which data fields to include
in the graph
- Format of the finished report
(look and style of the graph)

Intuitive Ease of Use
The
Graph Maker design is based on the Report Writer. Once the user is familiar with
one system, the other is intuitive.
<- Previous
 Top
Next ->
Top
Next ->
| 
)